At SiteSee, a common question asked of us is "what is the accuracy of your photogrammetry model?". For tower infrastructure owners & co-locating tenants concerned with accuracy of information - this is a justified question. This article outlines SiteSee's methods in answering this question.
It is important to note that this article is comparing accuracy not precision. For a good explanation of the difference between accuracy and precision please click here to for a detailed article written by James Dunthorne. To summarise, the accuracy is the difference of the means, and the precision is the standard deviation of the measurements.
While the question seems simple enough, it is difficult to answer. I was expecting a simple answer like “+-Xmm”. It is not that simple. Accuracy requires a reference or known measurement for comparison. This is a problem, as we are measuring real world infrastructure in the real world environment. Real world means the wind moves the structure, the sun heats and expands the steel structure - thus changing the dimensions. Hence the expected variation would limit the overall accuracy of any measurement method.
This experiment is not meant to be an exhaustive exercise in surveying. But rather a short, sharp determination of the suitability of the SiteSee photogrammetry model’s accuracy compared to the industry bench mark of a Lieca Laser Scan.
The results are surprisingly close given the laser scanner is $140K compared to the photogrammetry capture equipment costs of $7K.
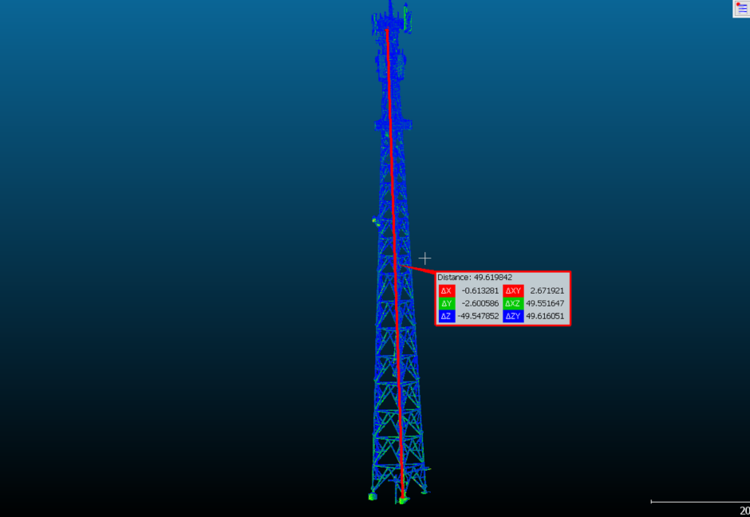
This fundamentals of the experiment is to measure between two elements of a Telco lattice tower with a Laser Scanner and compare it to a model prepared by SiteSee using Photogrametry, UAV and GCP. The reference measurements being used are generated by a Lieca Laser Scanner, which is considered to be a good surveyor quality instrument.
The two model elements being measured are;
a) underside of a gantry to,
b) the underside of the steel resting on footing.
There are three dimension of each point, however this experiment is concerned with the major dimension of the telco tower, the vertical or 'z' dimension.

Target: Telco Tower, Pullenvale Brisbane Australia
Lidar Acquisition: Leica P40, unknown number of scans, .pts file.
Photogrammetry: DJI Phantom 4Pro, 5xPropeller Aeropoints, Context Capture v4.4.8.561.
File Type / Output: .obj mesh model.
Measurement software: CloudCompare V2.9beta.
Background to Data Acquisition:
The tower was flown with a DJI phantom P4 Pro, using SiteSee's purpose built TowerCapture app developed in cooperation with Drone Harmony. Propeller Aero points were used to for Ground Control Points (GCP). The flight plan follows SiteSee's proprietary vertical structure flight plan. Approximately 1500 images were captured. ContextCapture was used to perform the photogrammetry. No manual tie points were used, just the GCP. The resulting model was a mesh in OBJ format with texture.
The lidar was captured by CR. Kennedy using the Leica P40. It is unknown how many scans were used. The resulting point cloud was provided in a PTS format.
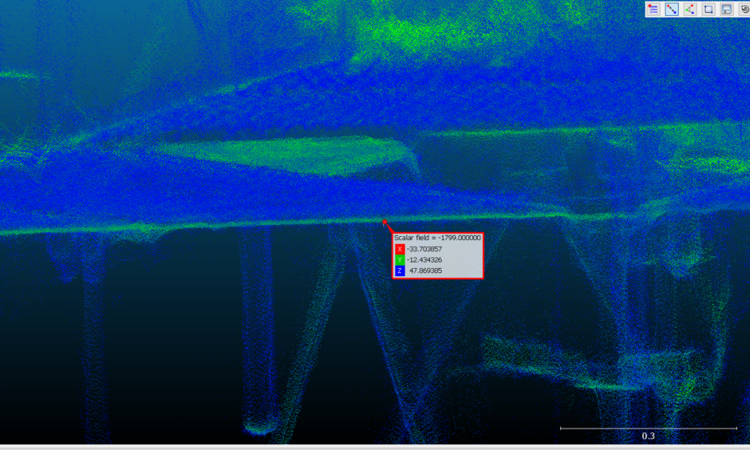
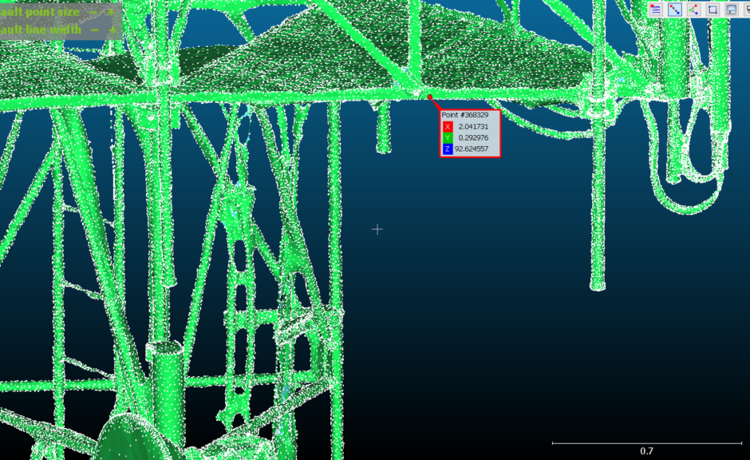
The procedure of measurement was very simple. Select a point in lidar point cloud/mesh using the CloudCompare measure tool, followed by the second point. However, it became evident that identifying the physical edge in the model is far from simple. There is no clear definition of an edge when zooming into the target area. The underside of the gantry becomes a blur of points. This became the first point of error. Edge selection. Rather than performing any post processed edge detection or filtering, this experiment is using the points as they are in the model. It is hoped that it demostrates the complex nature of describing accuracy in a real word model capture.


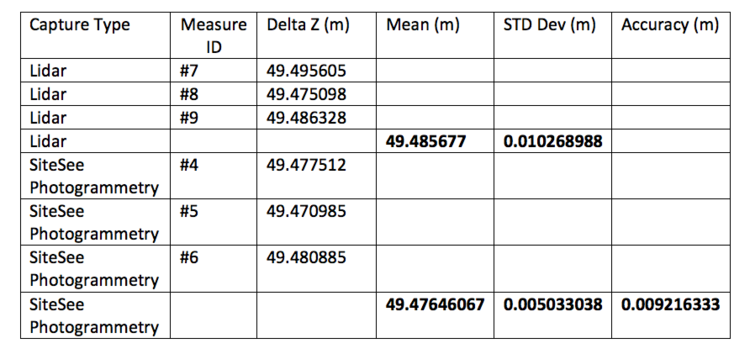
The excellent free software tool, Cloudcompare displays the deltas of each dimension between the two points. For this experiment only the delta Z is of concern. Three sets of points were measured and tabled below.

What is striking is that the mean of the sets are surprisingly similar with approximately 10mm difference in accuracy. Although the laser scan standard deviation is double that of the photogrammetry, it can not be used for a rigorous determination due to the small data set of three points. The accuracy result of 9mm is less than the precision of the lidar set. This is a clear indication that the sample set is too small for detailed analysis. However, what is important is the similarity between the lidar and photogrammetry results.
So what is the accuracy of the SiteSee model? The answer is going to be very specific. Over 50m vertical, SiteSee's achieves a variation of just +-10mm. Take the statement with a realisation that it is not a simple process to determine real world measurement accuracy.
What does this mean for tower owners?
Maintaining accurate as-built documentation for tower owners is critical for a number of reasons. Firstly, it ensures equipment has been installed as per design. Current practices lack transparency - relying on subcontractors to install and audit their own work. While it is common for 'spot checks' to be performed on a sample of new builds / upgrades, sometimes non-approved installations fall through the cracks - often only being picked up outside of the typical twelve month contractor liability period.
By utilising SiteSee's solution whenever a physical change / upgrade / decommission occurs, SiteSee's infrastructure digital twin & automated as-built documentation helps tower infrastructure owners maximise tower utilisation. The SiteSee solution also provides tower owners with new customer facing services to assist carriers & contractors to make more informed decisions throughout the planning and design phase without having to visit site.


